Node-RED Visualization
In today's digital era, data has become the lifeblood of industries, driving decision-making processes, optimizing operations, and improving efficiency across various sectors. However, the volume and complexity of data can often overwhelm traditional methods of analysis and interpretation. This is where data visualization plays a critical role, transforming raw data into meaningful, easily understandable, actionable insights. With the emergence of innovative technologies such as Node-RED running on KIWI boards, the data visualization process has been revolutionized, offering unprecedented flexibility, scalability, and accessibility.
KIWI board Visualization with Node-RED
Node-RED's drag-and-drop interface revolutionizes IoT development by simplifying the creation of complex workflows. Unlike traditional programming environments and proprietary platforms, Node-RED offers a user-friendly visual interface that enables developers to prototype and iterate quickly without extensive coding knowledge. With its intuitive design, users can drag nodes representing various functions or data sources onto a canvas and connect them to construct their applications effortlessly. This streamlined approach accelerates development, empowers customization by creating custom nodes, and fosters collaboration within a vibrant community of users and contributors.
Benefits of Visualization with Node-RED
In contrast to other programs, Node-RED's drag-and-drop functionality enhances usability while maintaining extensibility and cost-effectiveness. By eliminating the steep learning curves associated with traditional IDEs and proprietary platforms, Node-RED democratizes access to IoT development tools, making them accessible to developers of all skill levels. Furthermore, its open-source nature ensures developers can customize their workflows without constraints, while active community support provides resources and guidance to overcome challenges.
Dashboard in Node-RED
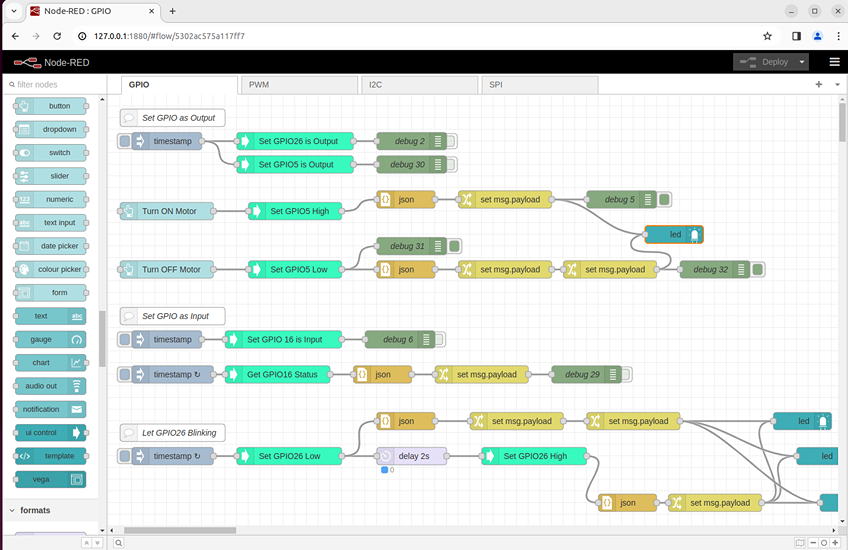
To test the feature of utilizing the node-red-dashboard package in KIWI boards, follow these steps:
- Begin by downloading the node-red-dashboard package. This package provides a collection of nodes for creating interactive dashboards in Node-RED. You can obtain this package from the Node-RED library or the npm registry.
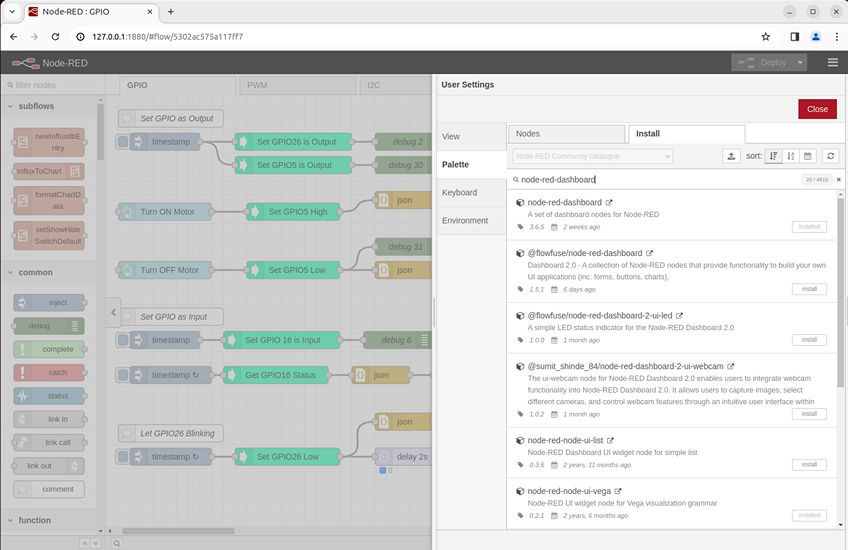
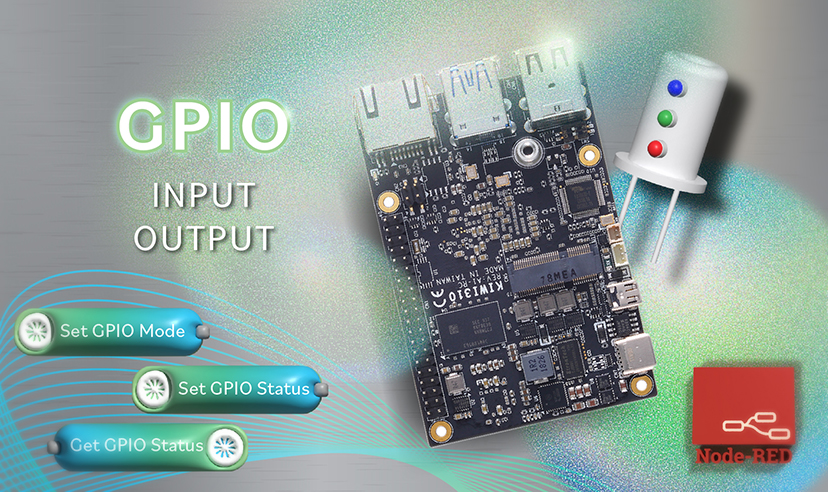
- After the package is successfully installed, you'll find a variety of dashboard nodes available in the Node-RED palette. Choose the appropriate input or output nodes. Refer to our previous post for information on connecting inputs and outputs.
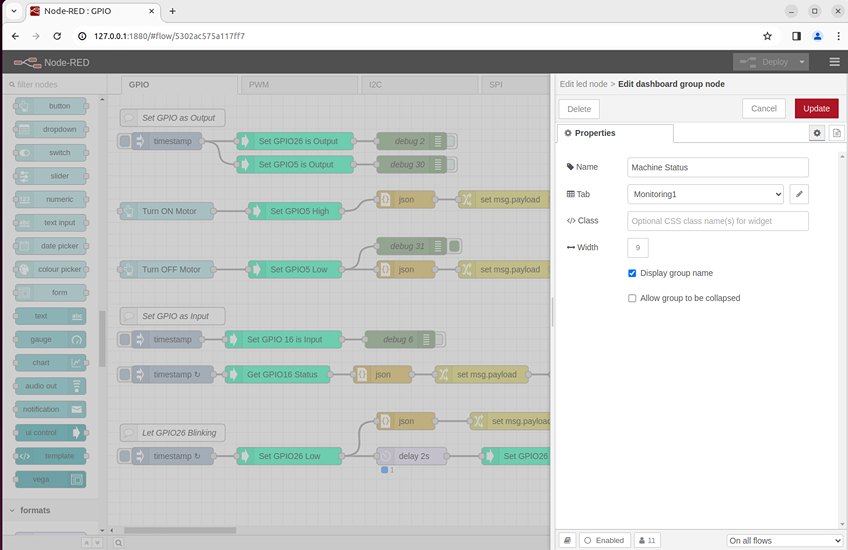
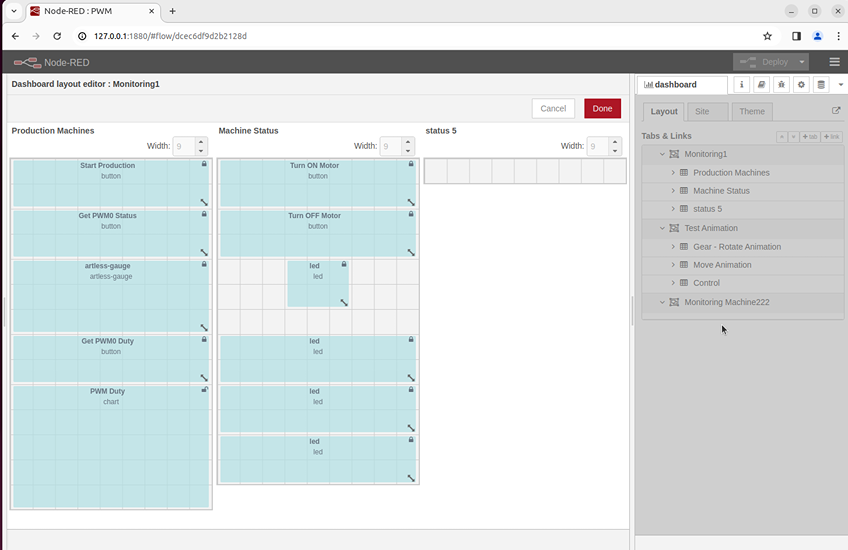
- Organize your dashboard by creating groups and tabs for group-related widgets together. Drag and drop a "group" node onto the canvas to configure it to contain the desired gadgets. Then, add a "tab" node to create separate tabs for different sets of gadgets, providing a structured layout for your dashboard.
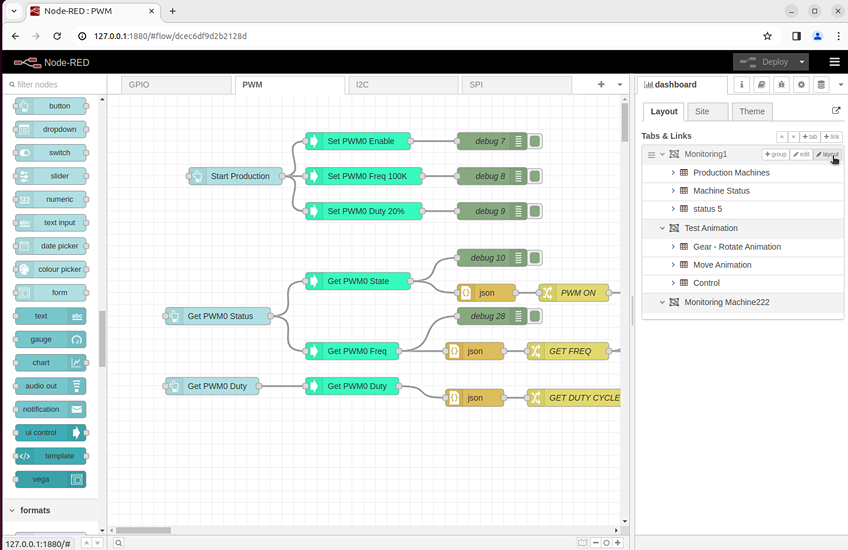
- Customize the layout of your dashboard by accessing the "layout" settings. This allows you to manage the distribution and arrangement of gadgets within groups and tabs. You can resize, rearrange, and align gadgets to create an intuitive and visually appealing dashboard layout.
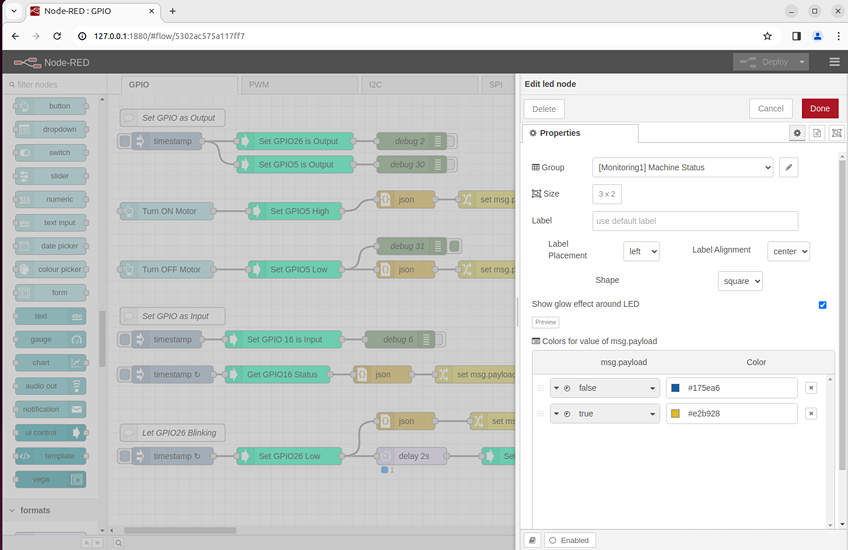
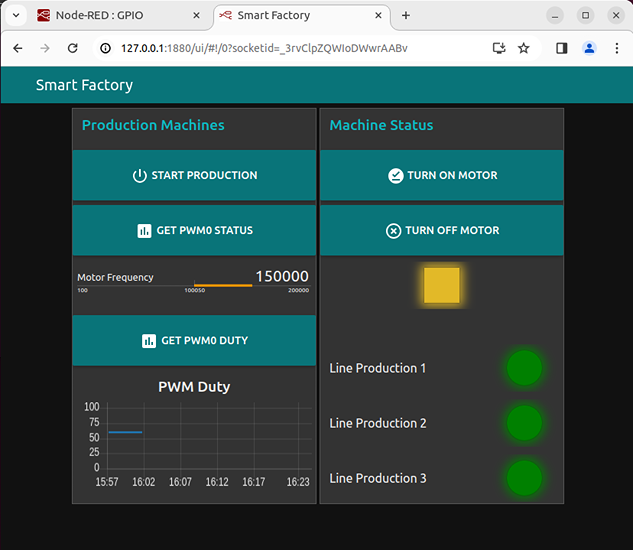
- With your dashboard configured and gadgets arranged, explore the diverse widgets in the node-red-dashboard package. Experiment with widgets such as graphs, gauges, charts, buttons, and text displays to visualize your data effectively. Enjoy the real-time visualization of your IoT data streams with these dynamic widgets.
Why KIWI board Solutions?
Choosing KIWI board with Node-RED for visualization offers a compelling solution for harnessing the power of IoT data. KIWI board's intuitive interface, combined with Node-RED's drag-and-drop functionality, simplifies the creation of complex IoT applications, making it accessible to users of all skill levels. With seamless integration of the node-red-dashboard package, users can effortlessly design captivating dashboards and visualize data streams using a diverse range of customizable widgets. Whether monitoring sensors, controlling devices, or analyzing data, KIWI board with Node-RED empowers users to create dynamic and responsive visualizations that enhance decision-making and drive innovation in the IoT space.
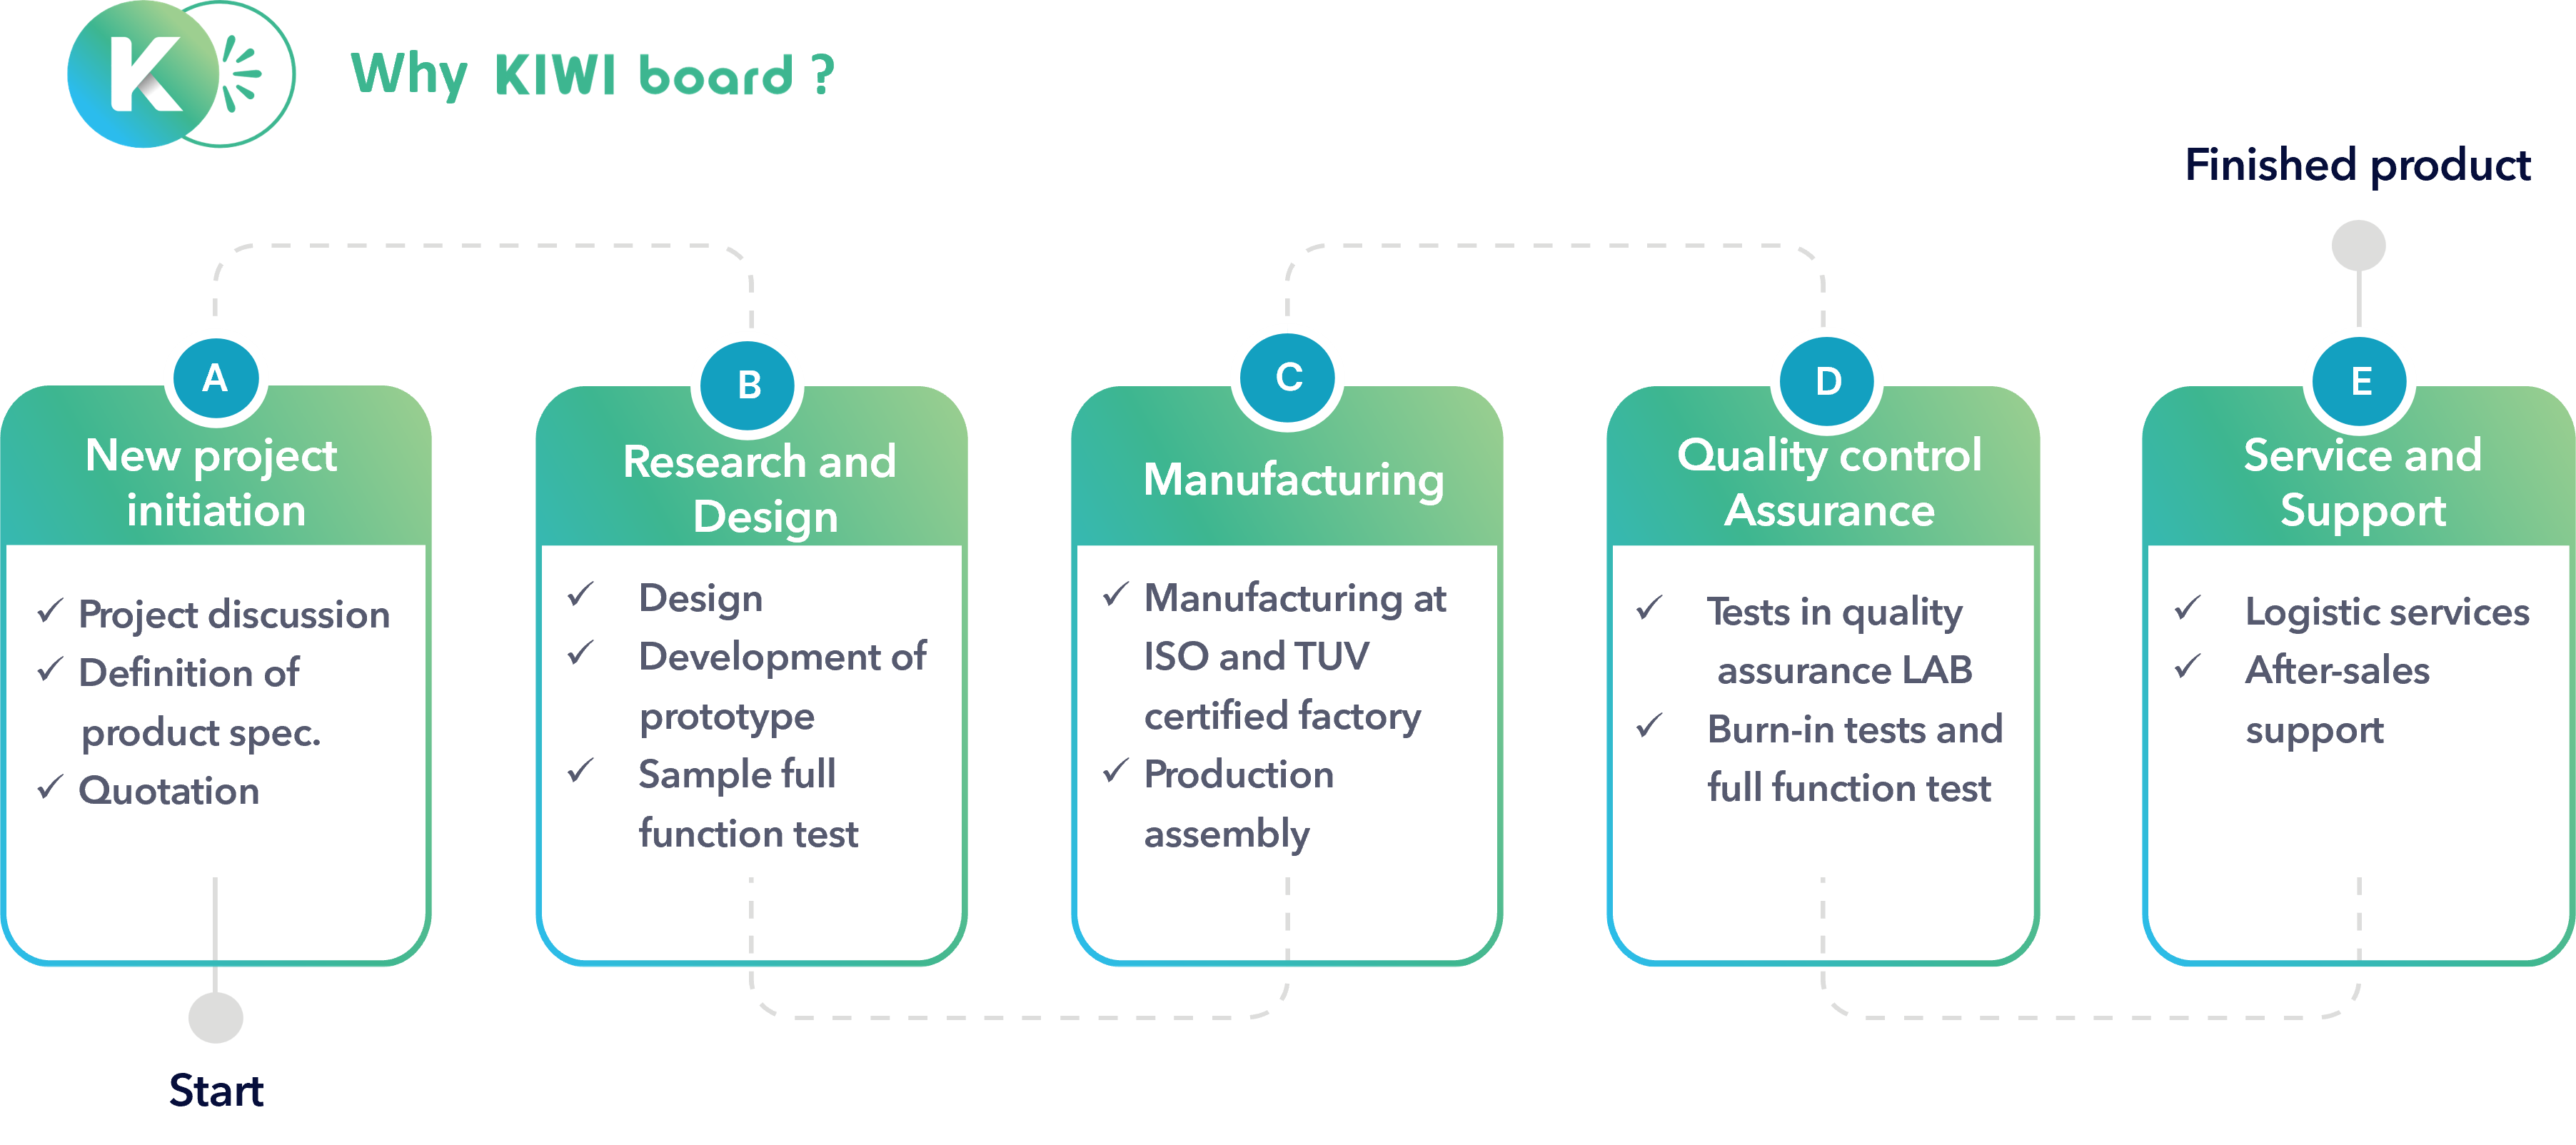
About KIWI board
KIWI board is a complete solution provider, supporting all aspects of your project, from hardware to software to system integration, to keep your application running securely, reliably, and at peak performance. KIWI board builds its products for high reliability, performance, security, scalability, and versatility. So, customers can expect a long lifespan, quickly adapt to evolving system requirements, and adopt future technologies as they emerge.
Next steps
Ready to talk about your projects with a KIWI board expert? Contact us
Want to hear more from KIWI board? For our newsletter, Sign up
Or request a quotation
.jpg)